How to Predict Northern Lights – Guide to Space Weather
Predicting the Northern Lights might seem like advanced astrophysics, but the basics are easy to master. By tracking specific space weather metrics, you can predict with high accuracy when an aurora display is about to start in your location. Here is a breakdown of the key metrics to follow.
⚡ Key Takeaways / Quick Summary
- The Kp index (0–9) measures geomagnetic disturbances: Kp 1–2 works for Lapland, whereas Kp 4+ is needed for Southern Finland.
- The southward IMF Bz value is the crucial short-term trigger: when Bz points south (negative, -5 to -20 nT), energy pours into the magnetosphere.
- Local cloud cover is decisive: always check cloud cover forecasts and live maps before heading out into the cold.
1. Kp Index – Global Geomagnetic Metric
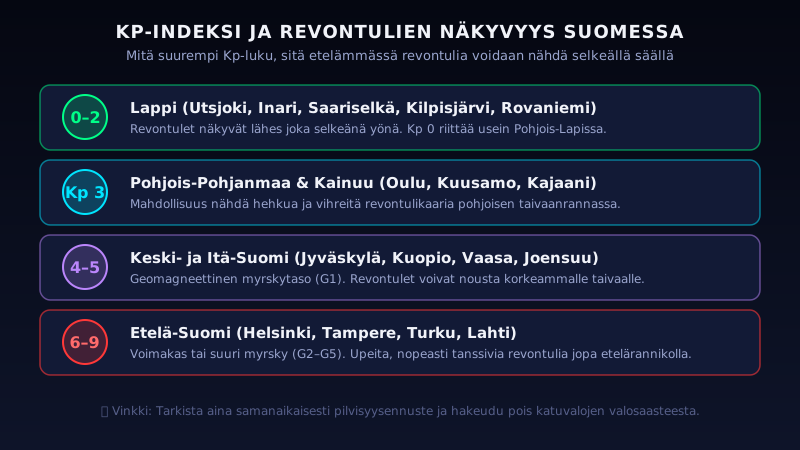
The Kp index measures disturbances in the Earth's magnetic field over a 3-hour period on a scale from 0 to 9. It indicates how far south the auroral oval is likely to expand:
- Kp 1–2: Auroras visible in Lapland (Northern Finland).
- Kp 3–4: Good chances in Central Finland.
- Kp 5 (G1-class geomagnetic storm): Auroras can expand to Southern Finland and Helsinki.
- Kp 6+ (G2-G5 storms): Strong, bright auroras across all of Finland and Northern Europe.
2. Solar Wind Speed and Density
Auroras are caused by charged particles from the Sun colliding with Earth's atmosphere. This stream is the solar wind. Monitor these live satellite metrics:
- Speed: Standard speed is around 300–400 km/s. Speeds above 500 km/s indicate heightened activity, and speeds exceeding 700 km/s often trigger dramatic, fast-crawling auroras.
- Density: Represents the concentration of solar particles (n/cm³). Higher density leads to brighter, more saturated colors. Values above 10 particles/cm³ are a great sign.
3. Bz Value – The Interplanetary Gate
This is the ultimate secret of experienced aurora hunters. Bz represents the vertical direction of the interplanetary magnetic field (IMF).
When Bz is positive (+) (pointing north), Earth's magnetosphere repels the solar wind. When Bz turns negative (-) (pointing south), it cancels out our magnetic shield, opening the gate for solar particles to enter the atmosphere. Look for values below -5 nT (nanotesla).
4. Local Magnetometers
Local magnetometers (like the station network of the Finnish Meteorological Institute) measure real-time local magnetic swings. A sharp, rapid drop in local magnetometer charts (e.g., a deflection of 200–500 nT or more) indicates that an active overhead substorm (aurora display) is happening right now.
Scientific sources and references:
- NOAA Space Weather Prediction Center - Live satellite solar wind and IMF measurements.
- Finnish Meteorological Institute - Magnetometers and local space weather.